Case study 07 / Live sample
A live dashboard from public data.
A working retail analytics dashboard built from Google's public TheLook eCommerce dataset — BigQuery for ingestion, SQL for definitions, Streamlit for publication. It shows the full loop from source to decision, using data anyone can inspect.
Public synthetic dataset. No client data is used. The app is live on Streamlit Community Cloud and the SQL is on GitHub.
01 / Why a live sample
A screenshot proves a chart. A live app proves the system.
Most portfolio dashboards are shown after the fact: a static image, a polished slide, a number without a way to challenge it. This one is running. The SQL, the metric definitions, the refresh path and the deployed app are all inspectable — and the period filter lets a reviewer test the story rather than take it on trust.
The dataset is public and synthetic, so there is no confidentiality problem in showing the whole pipeline. The method is the same one used on client work: start from the decision, define the metric, ingest the source, find the driver, and ship the view that makes the next action obvious.
02 / The pipeline
BigQuery in, decisions out.
Eight SQL extracts turn the raw TheLook tables into small, purpose-built tables: monthly KPIs, category economics, product performance, cohort retention, customer distribution, acquisition source and inventory ageing. The extracts are written to Parquet and committed to the repository.
That choice is deliberate. Querying BigQuery on every page load would put credentials in a public app, add query cost per visitor and make the dashboard slow. Reading a 250 KB Parquet extract keeps the app fast and reproducible; the pipeline can refresh on a schedule or be run manually. The incomplete current month is excluded so every trend ends on a complete period.
03 / What it answers
Four views, one decision loop.
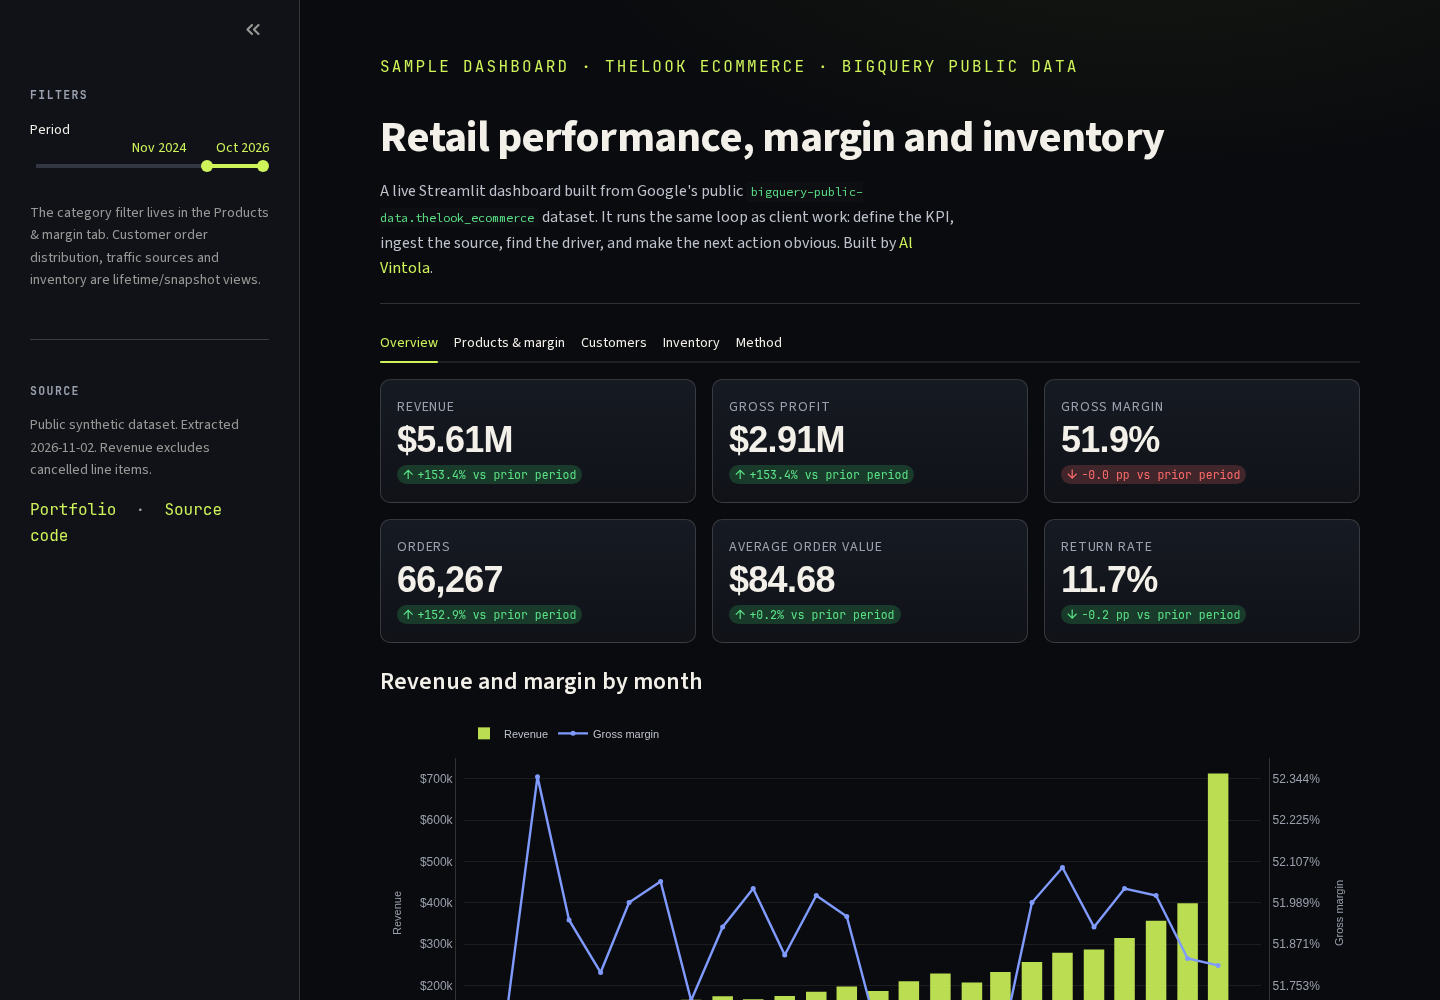
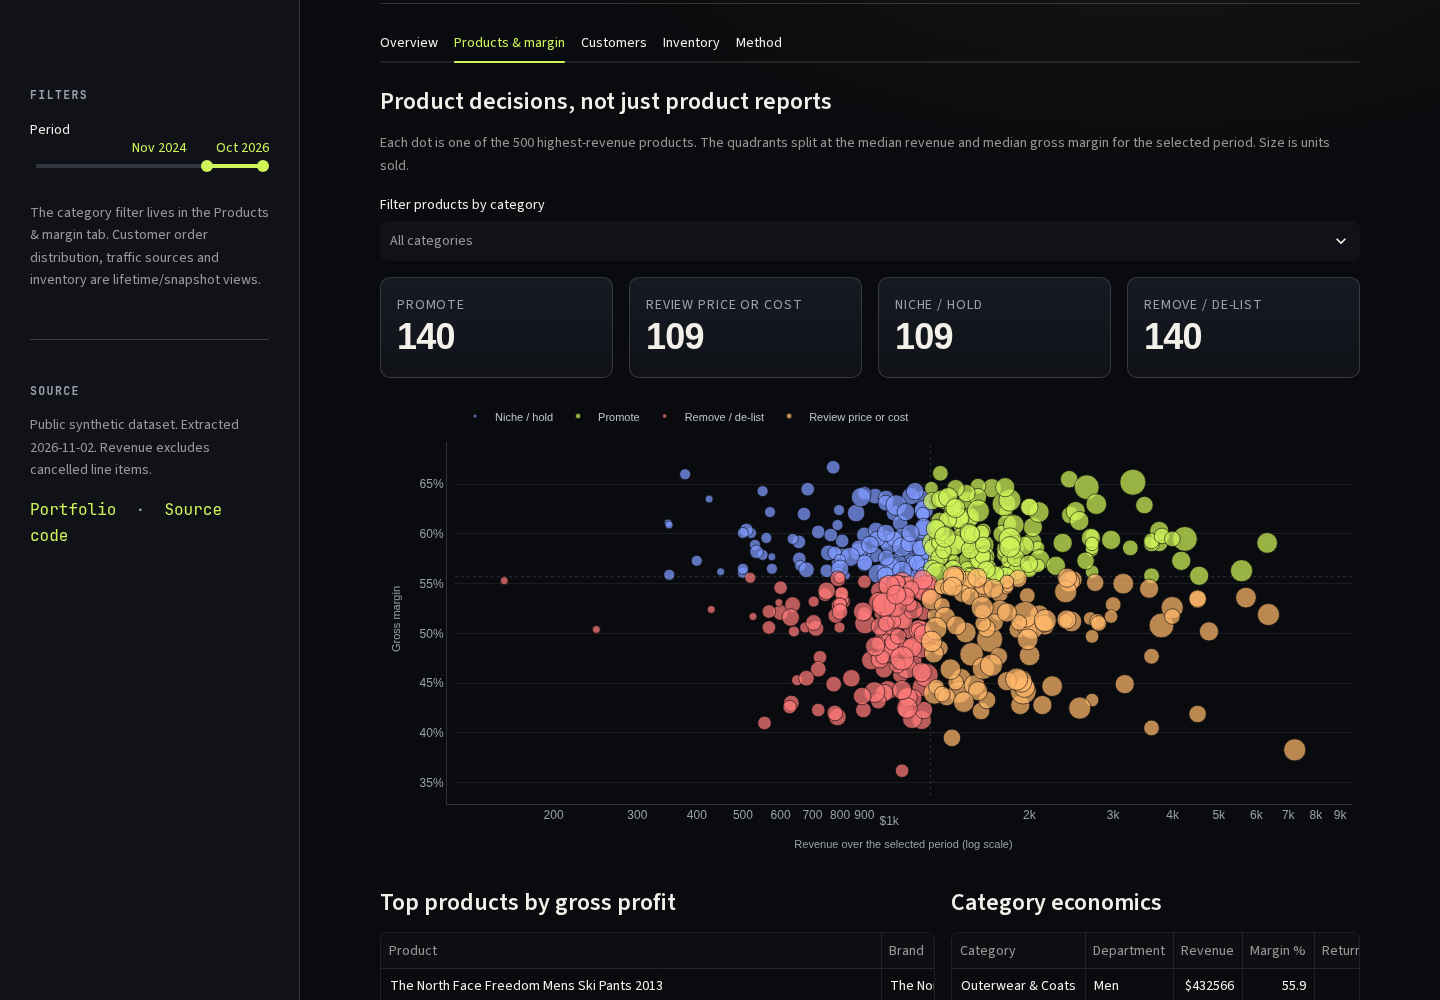
Overview compares revenue, gross profit, margin, orders, average order value and returns with the preceding window of equal length. Products & margin places the top products on a margin-versus-revenue view and labels them promote, hold, review or remove. Customers shows repeat rate, the lifetime order distribution, cohort retention and acquisition-source performance. Inventory shows unsold share, capital tied up in stock and days to sell by category.
Each tab starts from a question a manager would actually ask, not from a chart type. The product matrix is the one that most often changes the conversation: a product can be high revenue and still be a poor use of cash if the margin is thin.
04 / Definitions that change the answer
The metric definitions are the analysis.
Small definitions move rankings. A cancelled line item is not revenue. A returned item can still have been sold. Averaging a monthly margin is not the same as dividing total profit by total revenue. The dashboard recomputes ratios from the aggregated components and excludes the incomplete current month; the SQL is public so a reviewer can challenge any choice.
| Metric | Definition | Why it matters |
|---|---|---|
| Revenue | SUM(sale_price), cancelled line items excluded | Cancellations otherwise inflate the top line |
| Gross margin | (revenue − product cost) ÷ revenue | Revenue rank hides low-margin products |
| Return rate | Line items with non-null returned_at ÷ all units | A pricing win can be a fulfilment or fit problem |
| Repeat rate | Customers with 2+ lifetime orders ÷ all customers | Separates acquisition from retention |
05 / From sample to client build
The sample is the pattern, not the production build.
For a client, the same loop gets a production wrapper: a private GCP project, a least-privilege service account, dbt models with tests, a scheduled refresh with freshness checks, row-level security, and alerting when a KPI moves outside its expected range. The Streamlit app would sit behind SSO and the KPI dictionary would have a named owner.
The public sample deliberately stops short of that. It is small enough to read, cheap enough to run for free, and honest about what it is: a demonstration of the pipeline and the decision layer, not a claim about a real retailer.
- Every published number traces back to a SQL file in the repository.
- The app reads committed extracts, so it loads without a BigQuery round-trip.
- The current month is excluded so the trend ends on a complete period.
- The product extract is capped at the 500 highest-revenue products to keep the public repo small.
06 / Limitations
What this sample is — and isn't.
TheLook is synthetic public data. Its growth, seasonality and customer behaviour are generated, so the trends demonstrate method rather than market truth. The cost and return definitions are simplified, the product extract covers the head of the range rather than every SKU, and nothing here supports a causal claim. Treat it as a working example of the system — one that can be inspected, reproduced and replaced with a client's own source.